


Page 140 - รายงานประจำปี 2567 สำนักงานประกันสังคม
P. 140
Investment Management Status and Returns


                Social Security Fund

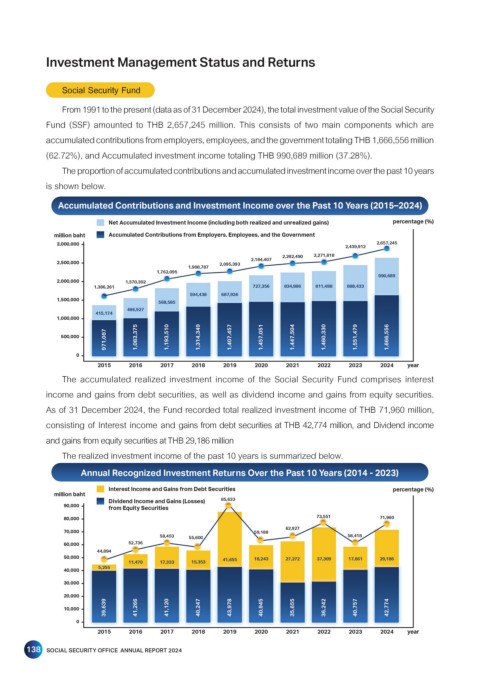
                From 1991 to the present (data as of 31 December 2024), the total investment value of the Social Security
            Fund (SSF) amounted to THB 2,657,245 million. This consists of two main components which are
            accumulated contributions from employers, employees, and the government totaling THB 1,666,556 million

            (62.72%), and Accumulated investment income totaling THB 990,689 million (37.28%).
                The proportion of accumulated contributions and accumulated investment income over the past 10 years

            is shown below.

               Accumulated Contributions and Investment Income over the Past 10 Years (2015–2024)

                            Net Accumulated Investment Income (including both realized and unrealized gains)  percentage (%)
              million baht  Accumulated Contributions from Employers, Employees, and the Government
               3,000,000                                                               2,439,912  2,657,245
                                                                       2,282,490  2,271,818
                                                               2,184,407
               2,500,000                               2,095,393
                                                1,908,787
                                        1,762,095
                                                                                               990,689
               2,000,000        1,570,302
                        1,386,261                               727,356  834,986  811,488  888,433
                                                594,438  687,936
               1,500,000
                                        568,585
                                486,927
                         415,174
               1,000,000
                           971,087
                500,000            1,083,375  1,193,510  1,314,349  1,407,457  1,457,051  1,447,504  1,460,330  1,551,479  1,666,556
                    0
                         2015    2016    2017    2018   2019    2020    2021    2022    2023   2024   year
                The accumulated realized investment income of the Social Security Fund comprises interest
            income and gains from debt securities, as well as dividend income and gains from equity securities.
            As of 31 December 2024, the Fund recorded total realized investment income of THB 71,960 million,

            consisting of Interest income and gains from debt securities at THB 42,774 million, and Dividend income
            and gains from equity securities at THB 29,186 million
                The realized investment income of the past 10 years is summarized below.

                     Annual Recognized Investment Returns Over the Past 10 Years (2014 - 2023)

                            Interest Income and Gains from Debt Securities                        percentage (%)
              million baht
                            Dividend Income and Gains (Losses)  85,633
                 90,000     from Equity Securities
                 80,000                                                         73,551         71,960
                                                                        62,927
                 70,000                                         59,188
                                         58,453  55,600                                58,418
                 60,000          52,736
                         44,894
                 50,000                                 41,655  18,243  27,272  37,309  17,661  29,186
                                 11,470  17,333  15,353
                         5,255
                 40,000
                 30,000
                 20,000
                           39,639  41,266  41,120  40,247  43,978  40,945  35,655  36,242  40,757  42,774
                 10,000
                    0
                         2015    2016    2017    2018   2019    2020    2021    2022    2023   2024   year
       138  SOCIAL SECURITY OFFICE  ANNUAL REPORT 2024

