


Page 150 - รายงานประจำปี 2567 สำนักงานประกันสังคม
P. 150
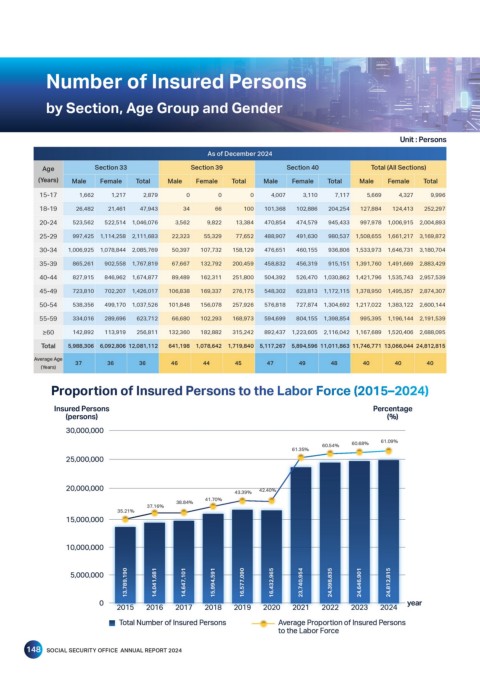
Number of Insured Persons


            by Section, Age Group and Gender


                                                                                                    Unit : Persons
                                                    As of December 2024

           Age          Section 33              Section 39              Section 40           Total (All Sections)
          (Years)  Male   Female   Total   Male   Female  Total   Male   Female   Total   Male   Female   Total

           15-17     1,662   1,217  2,879      0       0       0    4,007   3,110   7,117   5,669   4,327   9,996
           18-19    26,482  21,461  47,943    34      66     100   101,368  102,886  204,254  127,884  124,413  252,297
           20-24   523,562  522,514  1,046,076  3,562  9,822  13,384  470,854  474,579  945,433  997,978  1,006,915  2,004,893
           25-29   997,425  1,114,258  2,111,683  22,323  55,329  77,652  488,907  491,630  980,537  1,508,655  1,661,217  3,169,872
           30-34  1,006,925  1,078,844  2,085,769  50,397  107,732  158,129  476,651  460,155  936,806  1,533,973  1,646,731  3,180,704
           35-39   865,261  902,558  1,767,819  67,667  132,792  200,459  458,832  456,319  915,151  1,391,760  1,491,669  2,883,429
           40-44   827,915  846,962  1,674,877  89,489  162,311  251,800  504,392  526,470  1,030,862  1,421,796  1,535,743  2,957,539
           45-49   723,810  702,207  1,426,017  106,838  169,337  276,175  548,302  623,813  1,172,115  1,378,950  1,495,357  2,874,307

           50-54   538,356  499,170  1,037,526  101,848  156,078  257,926  576,818  727,874  1,304,692  1,217,022  1,383,122  2,600,144
           55-59   334,016  289,696  623,712  66,680  102,293  168,973  594,699  804,155  1,398,854  995,395  1,196,144  2,191,539
           ≥60     142,892  113,919  256,811  132,360  182,882  315,242  892,437  1,223,605  2,116,042  1,167,689  1,520,406  2,688,095
           Total  5,988,306  6,092,806 12,081,112  641,198  1,078,642  1,719,840  5,117,267  5,894,596 11,011,863 11,746,771 13,066,044 24,812,815
         Average Age  37    36     36      46      44      45      47      49      48      40      40      40
           (Years)

              Proportion of Insured Persons to the Labor Force (2015–2024)

              Insured Persons                                                                 Percentage
                 (persons)                                                                       (%)
                 30,000,000

                                                                                 60.54%  60.68%  61.09%
                                                                         61.35%
                 25,000,000


                 20,000,000                                      42.40%
                                                           43.39%
                                                    41.70%
                                             38.84%
                                     37.16%
                              35.21%
                 15,000,000

                 10,000,000


                                13,789,190  14,041,681  14,647,101  15,994,591  16,577,090  16,432,965  23,740,954  24,398,835  24,646,901  24,812,815
                  5,000,000


                          0                                                                           year
                              2015   2016   2017    2018   2019   2020    2021   2022   2023   2024
                              Total Number of Insured Persons         Average Proportion of Insured Persons
                                                                      to the Labor Force

       148  SOCIAL SECURITY OFFICE  ANNUAL REPORT 2024

