
Page 970 - MiSUMi FA Mechanical Components Economy Series
P. 970
[Technical Data]
Surface Roughness
JIS B 0601(1994)
Excerpts from JIS B 0031(1994)
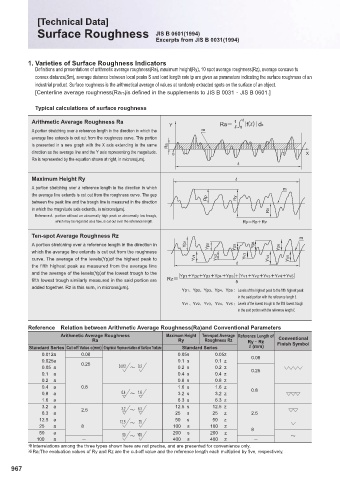
1. Varieties of Surface Roughness Indicators
Defi nitions and presentations of arithmetic average roughness(Ra), maximum height(Ry), 10 spot average roughness(Rz), average concave to
convex distance(Sm), average distance between local peaks S and load length rate tp are given as parameters indicating the surface roughness of an
industrial product. Surface roughness is the arithmetical average of values at randomly extracted spots on the surface of an object.
[Centerline average roughness(Ra75)is defi ned in the supplements to JIS B 0031 v JIS B 0601.]
Typical calculations of surface roughness
Arithmetic Average Roughness Ra 1 R ◊
Y Ra R 0 f Ex
A portion stretching over a reference length in the direction in which the m
average line extends is cut out from the roughness curve. This portion
is presented in a new graph with the X axis extending in the same Ra
direction as the average line and the Y axis representing the magnitude. 0 X
Ra is represented by the equation shown at right, in microns(μm).
R
Maximum Height Ry R
A portion stretching over a reference length in the direction in which m
the average line extends is cut out from the roughness curve. The gap
between the peak line and the trough line is measured in the direction Rp Ry
in which the magnitude axis extends, in microns(μm). Rv
Reference A portion without an abnormally high peak or abnormally low trough,
which may be regarded as a fl aw, is cut out over the reference length. RyRpRv
Ten-spot Average Roughness Rz m
1
A portion stretching over a reference length in the direction in Yp Yp2 3 Yp4 5
which the average line extends is cut out from the roughness Yp Yp
curve. The average of the levels(Yp)of the highest peak to V1 Y YV2 YV3 YV4 V5 Y
the fifth highest peak as measured from the average line R
and the average of the levels(Yp)of the lowest trough to the Yp 1 Yp 2Yp 3Yp Yp 5 Yv1Yv Yv Yv 4 Yv 5
4
2
3
fi fth lowest trough similarly measured in the said portion are Rz 5
added together. Rz is this sum, in microns(μm).
Yp1ծYp2ծYp3ծYp4ծYp5 Levels of the highest peak to the fifth highest peak
LQ WKH VDLG SRUWLRQ ZLWK WKH UHIHUHQFH OHQJWK Ɛ
Yv1ծYv2ծYv3ծYv4ծYv5 Levels of the lowest trough to the fifth lowest trough
LQ WKH VDLG SRUWLRQ ZLWK WKH UHIHUHQFH OHQJWK Ɛ
Reference Relation between Arithmetic Average Roughness(Ra)and Conventional Parameters
Arithmetic Average Roughness Maximum Height Ten-spot Average Reference Length of
Ra Ry Roughness Rz RyCRz Conventional
Standard Series Cut-off Value c(mm) Graphical Representation of Surface Texture Standard Series R(mm) Finish Symbol
0.012a 0.08 0.05s 0.05z
0.025a 0.25 0.1 s 0.1 z 0.08
0.05 a 0.012 ։ 0.2 0.2 s 0.2 z 0.25
0.1 a 0.4 s 0.4 z
0.2 a 0.8 s 0.8 z
0.4 a 0.8 1.6 s 1.6 z 0.8
0.8 a 0.4 ։ 1.6 3.2 s 3.2 z
1.6 a 6.3 s 6.3 z
3.2 a 2.5 3.2 ։ 6.3 12.5 s 12.5 z
6.3 a 25 s 25 z 2.5
12.5 a 12.5 ։ 25 50 s 50 z
25 a 8 100 s 100 z 8
50 a 50 ։ 100 200 s 200 z ։
100 a 400 s 400 z
GInterrelations among the three types shown here are not precise, and are presented for convenience only.
GRa:The evaluation values of Ry and Rz are the cut-off value and the reference length each multiplied by fi ve, respectively.
967