
Page 135 - PEA_AnnualReport_2016
P. 135
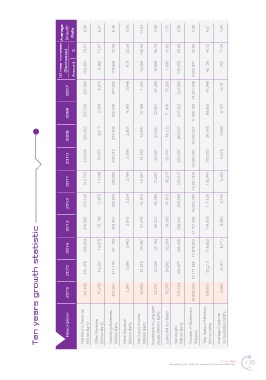
10 Year Increase  Average   (Decrease)  Growth   Rate  %  Amount  6.60  74.51  188,494  6.41  71.47  6,368  6.46  72.48  179,686  5.03  23.36  618  11.24  128.49  14,558  7.66  82.76  16,858  1.72  10.93  7,690  5.06  55.56  135,055  3.22  32.95  4,682,970  4.51  48.12  42,125  1.25  11.39  702


                                2007    252,964  8,910  247,898  2,646  11,330  20,369  70,385  243,094  14,210,946  87,548  6,161


                                2008    257,243  9,334  252,248  4,160  10,169  22,081  71,416  247,323  14,600,420  89,602  6,137


                                2009    280,882  9,417  273,492  2,807  14,000  21,520  74,123  262,037  15,060,631  90,145  5,986


                                2010    313,634  10,077  306,012  2,936  14,763  24,091  85,747  283,997  15,560,761  100,750  6,475


                                2011    313,702  11,048  308,525  3,764  12,461  21,607  95,217  303,817  16,021,918  102,947  6,425


                                2012    375,188  12,975  369,954  3,234  14,975  25,395  74,515  309,269  16,600,769  111,726  6,730


                                2013    418,888  15,182  409,450  3,542  21,078  26,240  79,385  328,084  17,157,493  114,609  6,680
                  Ten years growth statistic


                                2014    450,634  14,378  441,152  3,463  20,397  27,154  82,254  348,426  17,678,603  118,632  6,711


                                2015    451,476  14,331  441,140  3,595  21,072  37,230  84,283  366,977  18,171,025  123,210  6,781


                                2016    441,458  15,278  427,584  3,264  25,888  37,227  78,075  378,149  18,893,916  129,673  6,863


                                Description  Net Electric Revenue   (Million Baht)  Other Revenue  (Million Baht)  Operating Expenses   (Million Baht)  Other Expense  (Million Baht)  Net (Loss) Income   (Million Baht)  Investments In Long-term   Assets (Million Baht)  Loans (Million Baht)  Net Assets  (Million Baht)  Number of Customers   (Person)  Total Sales of Electricity   (Million kWh)  Average Customer   Consumption (kWh)


                                                                                                   SMART PEA   135
                                                                             Annual Report 2016 Provincial Electricity Authority