
Page 136 - PEA_AnnualReport_2016
P. 136
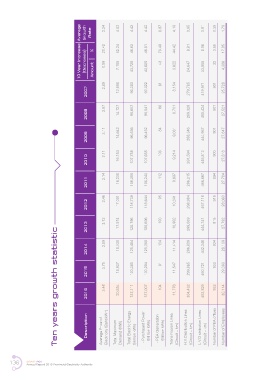
Average  Growth  Rate  2.24  4.83  4.42  4.42  6.97  4.19  0.95  0.91  0.39  1.79


                                     10 Year Increase  (Decrease)  %  Amount  20.42  0.59  52.24  7,156  46.83  43,728  46.81  43,685  70.49  43  44.42  3,622  8.81  24,647  8.06  33,858  3.55  32  17.05  4,386


                                                2.89  13,698  93,383  93,322  61  8,154          901  25,728
                                        2007                                          279,785  419,971


                                                2.87  14,127  95,607  95,541  66  8,701          901  27,521
                                        2008                                          289,328  450,424


                                                3.11  14,642  96,536  96,452  84  9,031          901  27,847
                                        2009                                          288,346  444,957


                                                3.11  16,154             103   9,214             900  27,818
                                        2010                107,758  107,655          291,594  445,813


                                        2011    3.14  16,208  108,355  108,243  112  9,697  296,215  456,667  894  27,784


                                                3.46  17,001             95    10,341            915  28,060
                                        2012                118,739  118,644          298,984  457,118


                                                3.73  17,574             100   10,992            915  27,792
                                        2013                120,796  120,696          299,069  444,741
                          Ten years growth statistic


                                        2014    3.89  18,030  125,484  125,380  104  11,414  296,809  442,348  934  28,109


                                                3.75  18,937             91    11,547            933  29,093
                                        2015                130,385  130,294          299,865  460,721


                                        2016    3.48  20,854  137,111  137,007  104  11,776  304,432  453,829  933  30,114


                                        Description  Average Price of  Electricity (Baht/kWh)  Total Maximum  Demand (MW)  Total Electric Energy   (Million kWh)    - Purchased Power         (Million kWh)    - PEA Generation        (Million kWh)  Transmission Lines   (Circuit – km)  H.V.Distribution Lines   (Circuit – km)  L.V.Distribution Lines   (Circuit – km)  Number of PEA offces  Number of Employees


     136     SMART PEA
             Annual Report 2016 Provincial Electricity Authority