
Page 131 - PEA_AnnualReport_2016
P. 131
(Unit : Million Baht) Consolidated Financial Statements Dec. 31, Dec. 31, 2015 2016 33,637.52 32,006.42 66,042.05 69,076.84 232,667.60 242,498.01 34,696.27 34,728.04 367,043.44 378,309.31 61,978.75 56,980.81 76,370.94 72,840.39 89,210.77 97,623.50 227,560.46 227,444.70 139,482.98 150,864.61 367,043.44 378,309.31
Headquarter Dec. 31, Dec. 31, 2015 2016 285.63 539.71 61,707.03 64,867.79 2,847.75 3,190.66 3,317.44 4,496.54 68,157.85 73,094.70 94,789.49 123,652.21 76,370.94 72,840.39 2,258.08 4,069.69 173,418.51 200,562.29 (105,260.66) (127,467.59) 68,157.85 73,094.70
Dec. 31, 2015 5,898.11 824.23 55,884.85 8,337.47 70,944.66 20,866.38 - 18,216.84 39,083.22 31,861.44 70,944.66
South -
Dec. 31, 2016 5,574.76 858.45 57,705.58 8,243.68 72,382.47 18,723.54 19,351.60 38,075.14 34,307.33 72,382.47
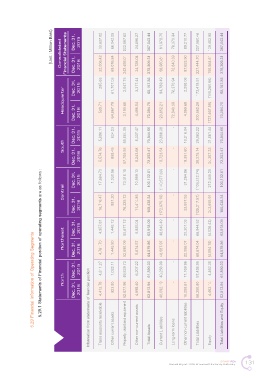
5.29.1 Statements of Financial position of operating segments are as follows :
Dec. 31, 2015 17,684.70 1,030.56 73,418.15 10,999.10 103,132.51 (140,577.60) - 31,264.86 (109,312.74) 212,445.25 103,132.51
Central -
Dec. 31, 2016 16,716.47 981.30 76,325.72 11,414.85 105,438.34 (172,075.10) - 33,857.53 (138,217.57) 243,655.91 105,438.34
Northeast Dec. 31, Dec. 31, 2015 2016 4,957.81 4,761.70 1,448.12 1,445.50 50,677.12 52,698.09 5,835.04 5,674.57 62,918.09 64,579.86 46,643.49 46,587.97 - 20,301.03 22,086.07 66,944.52 68,674.04 (4,026.43) (4,094.18) 62,918.09 64,579.86
5.29 Financial Information of Operating Segments
Dec. 31, 2015 4,811.27 1,032.11 49,839.73 6,207.22 61,890.33 40,256.99 - 17,169.96 57,426.95 4,463.38 61,890.33
Information from statements of fnancial position
North -
Dec. 31, 2016 4,413.78 923.80 52,577.96 4,898.40 62,813.94 40,092.19 18,258.61 58,350.80 4,463.14 62,813.94
Trade accounts receivable Property, plant and equipment Other non-current assets Other non-current liabilities Total Liabilities and Equity
Other current assets Total Assets Current Liabilities Long-term loans Total Liabilities Equity
SMART PEA 131
Annual Report 2016 Provincial Electricity Authority