
Page 132 - PEA_AnnualReport_2016
P. 132
(Unit : Million Baht) Consolidated Financial Statements Dec. 31, 2015 451,476.15 12,248.23 2,103.92 465,828.30 388,143.57 21,480.07 892.04 77.46 129.25 4,266.00 18,757.36 7,548.37 282.12 176.68 3,313.46 444,760.45 66.58 69.61 21,134.43 (141.94) 20,992.49
Dec. 31,
2016
- 441,458.47 13,188.63 280.96 2,148.16 1,505.82 456,795.26 1,786.78 371,670.59 - 23,159.69 3,748.25 1,082.62 137.72 59.90 4,704.89 626.83 19,007.28 1,295.16 7,889.74 1,302.06 97.52 3,087.74 3,281.65 430,908.48 10,549.09 66.58 25,956.39 (8,695.73) (1,543.76) (46.79) 24,412.63 (8,742.52)
Dec. 31,
2015
Headquarter Dec. 31, 2016 - 470.91 1,360.06 1,830.97 - 3,887.79 149.07 102.62 808.73 1,320.01 1,497.83 15.70 3,053.04 10,834.79 69.61 (8,934.21) (241.72) (9,175.93)
Dec. 31, 2015 76,626.75 2,676.50 207.09 79,510.34 66,408.04 3,799.01 159.54 4.49 992.72 4,237.86 1,686.54 103.01 8.29 77,399.50 - 2,110.84 (16.98) 2,093.86
South -
Dec. 31, 2016 75,724.54 2,609.29 129.39 78,463.22 64,365.55 4,203.02 202.08 6.49 917.89 4,322.85 1,651.40 64.60 9.29 75,743.17 2,720.05 (274.16) 2,445.89
Dec. 31, 2015 237,842.89 3,749.90 155.29 241,748.08 200,448.08 4,755.02 200.09 3.94 1,123.95 5,495.67 1,632.29 83.67 9.30 213,752.01 - 27,996.07 (39.02) 27,957.05
Central 6.55 9.48 -
Dec. 31, 2016 231,224.22 4,079.35 503.32 235,806.89 190,208.27 5,067.79 252.06 1,512.53 5,414.38 1,680.36 76.18 204,227.60 - 31,579.29 (368.64) 31,210.65
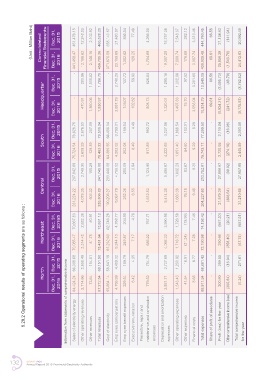
5.29.2 Operational results of operating segments are as follows :
Northeast Dec. 31, Dec. 31, 20165 2016 70,667.83 70,085.47 2,882.38 3,314.42 80.91 81.75 73,631.12 73,481.64 62,746.26 61,232.63 4,768.77 5,244.10 204.90 249.87 4.78 7.17 767.71 686.22 3,990.98 4,068.33 1,726.56 1,716.72 (18.99) (21.34) 7.45 7.28 74,198.42 73,190.98 - (567.30) 290.66 (20.21) (358.40) (587.51) (67.74)
Dec. 31, 2015 66,338.68 2,658.49 154.81 69,151.98 58,541.19 4,409.02 189.79 4.35 754.79 3,737.69 1,200.92 16.91 6.77 68,861.43 - 290.55 (18.94) 271.61
North -
Dec. 31, 2016 Information from statements of comprehensive income 64,424.24 2,714.66 73.64 67,212.54 55,864.14 4,756.99 229.54 6.42 779.52 3,881.71 1,343.43 41.54 8.65 66,911.94 300.60 (300.84) (0.24)
Sales of electricity energy Other operating revenues Other revenues Total revenues Cost of electricity Employee compensations Employee beneft expenses Executive remuneration Preventive, repair and maintenance, and construction expenses Depreciation and amortization expenses Other operating expenses Other expenses Financial costs Total expenses ar o profit o asso iat s
132 SMART PEA
Annual Report 2016 Provincial Electricity Authority