Page 26 - PEA_AnnualReport_2016
P. 26

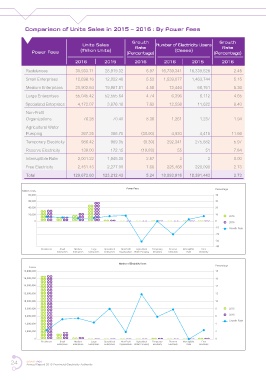
Comparison of Units Sales in 2015 – 2016 : By Power Fees


                                                            Growth                                 Growth
                                      Units Sales            Rate      Number of Electricity Users   Rate
               Power Fees            (Million Units)      (Percentage)         (Cases)           (Percentage)
                                   2016         2015         2016         2016         2015         2016
             Residences            30,933.71    28,919.32         6.97   16,739,341   16,339,526         2.45

             Small Enterprises     12,698.16    12,032.48         5.53    1,539,077    1,463,744         5.15
             Medium Enterprises    20,902.64    19,987.81         4.58       72,446      68,761          5.36

             Large Enterprises     55,045.42    52,555.64         4.74        6,396       6,112          4.65
            Specialized Enterprises  4,172.07    3,876.16         7.63       12,598      11,622          8.40
             Non-Proft
             Organizations            76.28         70.40         8.36        1,261       1,237          1.94
             Agricultural Water
             Pumping                 267.25       386.75        (30.90)       4,930       4,415         11.66
             Temporary Electricity   986.42       989.35         (0.30)     292,341     275,882          5.97

             Reserve Electricity     138.00       172.15        (19.83)         55           51          7.84
             Interruptible Rate     2,001.22     1,945.38         2.87           3            3          0.00
             Free Electricity       2,451.43     2,277.00         7.66      225,468     220,090          2.73

             Total                129,672.60   123,212.43         5.24   18,893,916  18,391,443          2.73


                                                          Power Fees                             Percentage
           Million Units
              80,000                                                                             40
              60,000                                                                             30
              40,000                                                                             20
              20,000                                                                             10    2015
                0                                                                                0     2016
                                                                                                 -10   Growth Rate
                                                                                                 -20
                                                                                                 -30
                                                                                                 -40
                   Residences  Small  Medium  Large  Specialized  Non- rofit  Agricultural  Temporary  Reserve  Interruptible   Free
                           Enterprises  Enterprises  Enterprises  Enterprises  Organizations Water Pumping  Electricity  Electricity  Rate  Electricity

                                                      Number of Electricity Users
              Cases                                                                              Percentage
            18,000,000                                                                           18
            16,000,000                                                                           16
            14,000,000                                                                           14
            12,000,000                                                                           12
            10,000,000                                                                           10
            8,000,000                                                                            8     2015
            6,000,000                                                                            6     2016
                                                                                                       Growth Rate
            4,000,000                                                                            4
            2,000,000                                                                            2

                0                                                                                0
                   Residences  Small  Medium  Large  Specialized  Non- rofit  Agricultural  Temporary  Reserve  Interruptible   Free
                           Enterprises  Enterprises  Enterprises  Enterprises  Organizations Water Pumping  Electricity  Electricity  Rate  Electricity


      24     SMART PEA
             Annual Report 2016 Provincial Electricity Authority
   21   22   23   24   25   26   27   28   29   30   31