
Page 24 - PEA_AnnualReport_2016
P. 24
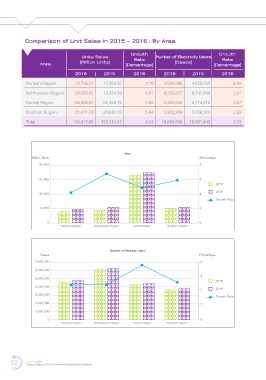
Comparison of Unit Sales in 2015 – 2016 : By Area


                                      Units Sales           Growth     Number of Electricity Users  Growth
                                                             Rate
                                                                                                    Rate
                   Area              (Million Units)     (Percentage)          (Cases)           (Percentage)
                                   2016        2015          2016         2016         2015         2016
             Northern Region       18,705.51   17,953.35          4.19    4,529,995    4,422,732         2.43

             Northeastern Region   20,565.82   19,254.99          6.81    6,295,877    6,147,499         2.41
             Central Region        68,529.51   65,358.73          4.85    4,265,840    4,114,912         3.67

             Southern Region       21,871.76   20,645.35          5.94    3,802,204    3,706,300         2.59

             Total                129,672.60  123,212.43          5.24   18,893,916  18,391,443          2.73


                                                         Area
               Million Units                                                              Percentage
                   80,000                                                                 8


                   60,000                                                                 6
                                                                                                 2015

                   40,000                                                                 4      2016
                                                                                                 Growth Rate
                   20,000                                                                 2


                      0                                                                   0
                            Northern Region  Northeastern Region  Central Region  Southern Region


                                                  Number of Electricity Users
                   Cases                                                                  Percentage
                 7,000,000                                                                 4
                 6,000,000
                 5,000,000                                                                 3
                                                                                                 2015
                 4,000,000
                                                                                           2     2016
                 3,000,000                                                                       Growth Rate
                 2,000,000                                                                 1

                 1,000,000
                      0                                                                    0
                            Northern Region  Northeastern Region  Central Region  Southern Region


      22     SMART PEA
             Annual Report 2016 Provincial Electricity Authority