Page 23 - PEA_AnnualReport_2016
P. 23

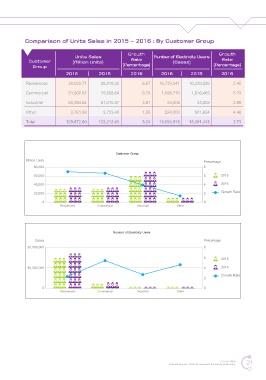
Comparison of Units Sales in 2015 – 2016 : By Customer Group


                                                          Growth                                   Growth
                                   Units Sales                        Number of Electricity Users
              Customer            (Million Units)           Rate              (Cases)               Rate
                Group                                   (Percentage)                            (Percentage)
                               2016          2015          2016          2016         2015          2016
             Residences         30,933.71     28,919.32          6.97   16,739,341    16,339,526         2.45

             Commercial         31,562.87     29,558.64          6.78    1,595,770     1,516,465         5.23
             Industrial         63,394.64     61,010.97          3.91       34,805       33,828          2.89

             Other               3,781.38      3,723.49          1.55      524,000      501,624          4.46

             Total             129,672.60    123,212.43          5.24   18,893,916    18,391,443         2.73


                                                     Customer Group
             Million Units                                                                  Percentage
                80,000                                                                      8

                60,000                                                                      6       2015
                40,000                                                                      4       2016

                20,000                                                                      2       Growth Rate
                    0                                                                       0
                            Residences      Commercial        Industrial        Other


                                                    Number of Electricity Users
                 Cases                                                                      Percentage
             20,000,000                                                                     8

                                                                                            6       2015

             10,000,000                                                                     4       2016
                                                                                                    Growth Rate
                                                                                            2
                    0                                                                       0
                            Residences       Commercial       Industrial        Other


                                                                                                   SMART PEA   21
                                                                             Annual Report 2016 Provincial Electricity Authority
   18   19   20   21   22   23   24   25   26   27   28