
Page 27 - PEA_AnnualReport_2016
P. 27
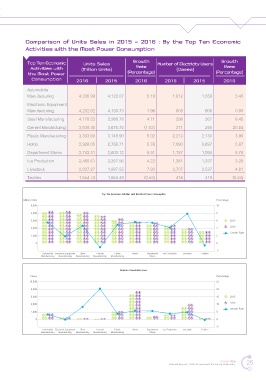
Comparison of Units Sales in 2015 – 2016 : By the Top Ten Economic
            Activities with the Most Power Consumption


             Top Ten Economic         Units Sales           Growth     Number of Electricity Users  Growth
               Activities with       (Million Units)          Rate              (Cases)              Rate
              the Most Power                              (Percentage)                           (Percentage)
               Consumption         2016         2015         2016          2016        2015          2016

             Automobile
             Manufacturing          4,335.98     4,122.07          5.19       1,612        1,559          3.40
             Electronic Equipment
             Manufacturing          4,262.62     4,180.73          1.96         608          608          0.00
             Steel Manufacturing    4,176.53     3,988.78          4.71         398          367          8.45
             Cement Manufacturing   3,638.35     3,675.75        (1.02)         311          258         20.54

             Plastic Manufacturing  3,303.68     3,145.90          5.02       2,213        2,130          3.90
             Hotels                 2,926.05     2,766.71          5.76       7,090        6,697          5.87
             Department Stores      2,743.31     2,600.12          5.51       1,157        1,094          5.76

             Ice Production         2,456.61     2,357.06          4.22       1,381        1,337          3.29
             Livestock              2,037.27     1,887.55          7.93       3,707        3,537          4.81
             Textiles               1,654.74     1,664.49        (0.59)         418          419         (0.24)


                                              Top Ten Economic Activities with the Most Power Consumption
            Million Units                                                                         Percentage
               5,000                                                                              10
               4,000                                                                              8

               3,000                                                                              6     2015
               2,000                                                                              4     2016
                                                                                                        Growth Rate
               1,000                                                                              2
                 0                                                                                0
                                                                                                  -2
                    Automobile Electronic Equipment  Steel  Cement  Plastic  Hotels  Department  Ice Production  Livestock  Textiles
                   Manufacturing  Manufacturing  Manufacturing  Manufacturing  Manufacturing  Stores

                                                       Number of Electricity Users
              Cases                                                                               Percentage
              10,000                                                                              25
               8,000                                                                              20
               6,000                                                                              15    2015
               4,000                                                                              10    2016
                                                                                                        Growth Rate
               2,000                                                                              5
                 0                                                                                0
                                                                                                  -5
                    Automobile Electronic Equipment  Steel  Cement  Plastic  Hotels  Department  Ice Production  Livestock  Textiles
                   Manufacturing  Manufacturing  Manufacturing  Manufacturing  Manufacturing  Stores


                                                                                                   SMART PEA   25
                                                                             Annual Report 2016 Provincial Electricity Authority