


Page 103 - รายงานประจำปี สำนักการวางผังและพัฒนาเมืองปี 2568
P. 103
2     แดิชื่บูอร์ดิข้้อมิูล่เมิ่อง : เปล่่�ยุนสถิติิให้เป็นภัาพิ่ที่่�เข้้าใจไดิ้ที่ันที่่
                        Urban Data Dashboards: Transforming Statistics into Intuitive Visualizations


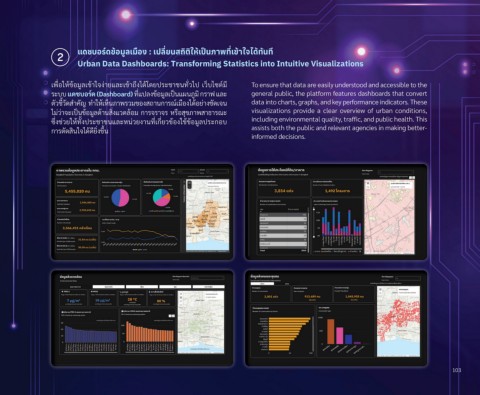
                เพั่�อให้ขั้อม่ล้เขั้าใจัง่ายแล้ะเขั้าถ่ึงได้โดยปีรุะช้าช้นทั�วิไปี เวิ็บไซึ่ต้์ม่  To ensure that data are easily understood and accessible to the
                รุะบบ แด้ช้บอร์ด้ (Dashboard) ท่�แปีล้งขั้อม่ล้เปี็นแผนภ่มิ กัรุาฟื้ แล้ะ  general public, the platform features dashboards that convert
                ต้ัวิช้่�วิัดสำาคัญ ทำาให้เห็นภาพัรุวิมขัองสถ่านกัารุณ์์เม่องได้อย่างช้ัดเจัน   data into charts, graphs, and key performance indicators. These
                ไม่วิ่าจัะเปี็นขั้อม่ล้ด้านสิ�งแวิดล้้อม กัารุจัรุาจัรุ หรุ่อสุขัภาพัสาธิารุณ์ะ   visualizations provide a clear overview of urban conditions,
                                                                             including environmental quality, traffic, and public health. This
                ซึ่ึ�งช้่วิยให้ทั�งปีรุะช้าช้นแล้ะหน่วิยงานท่�เกั่�ยวิขั้องใช้้ขั้อม่ล้ปีรุะกัอบ
                                                                             assists both the public and relevant agencies in making better-
                กัารุต้ัดสินใจัได้ด่ยิ�งขัึ�น
                                                                             informed decisions.


                                                                                                                                         103

