
Page 76 - PEA_AnnualReport_2016
P. 76
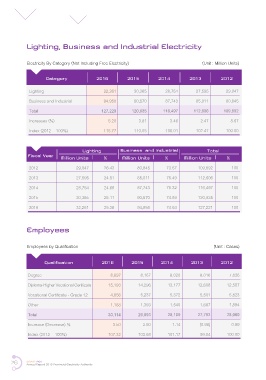
Lighting, Business and Industrial Electricity


             Electricity By Category (Not Including Free Electricity)                            (Unit : Million Units)


                      Category              2016          2015          2014          2013          2012

              Lighting                         32,261        30,365        28,754        27,595       29,047

              Business and Industrial          94,958        90,570        87,743        85,011       80,845

              Total                           127,229       120,935       116,497       112,606      109,892
              Increases (%)                      5.20          3.81          3.46          2.47         8.67

              Index (2012 = 100%)              115.77        110.05        106.01        102.47       100.00


                                      Lighting         Business  and Industrial               Total
              Fiscal Year   Million Units      %        Million Units      %       Million Units      %


              2012                 29,047       26.43         80,845       73.57          109,892       100
              2013                 27,595       24.51         85,011       75.49         112,606        100

              2014                 28,754       24.68         87,743       75.32         116,497        100

              2015                  30,365      25.11         90,570       74.89         120,935        100
              2016                 32,261       25.36         94,958       74.64         127,221        100


             Employees


             Employees by Qualifcation                                                             (Unit : Cases)


                     Qualification             2016         2015         2014         2013          2012

              Degree                              8,897         8,167        8,020        8,016        7,836

              Diploma-Higher Vocational Certifcate   15,193   14,296       13,177       12,608       12,507

              Vocational Certifcate - Grade 12   4,856         5,237        5,372        5,501        5,823

              Other                               1,168         1,393        1,540        1,667        1,894
              Total                              30,114        29,093       28,109       27,792       28,060

              Increase (Decrease) %                3.50          3.50         1.14        (0.96)        0.99

              Index (2012 = 100%)                107.32        103.68       101.17        99.04       100.00


      76     SMART PEA
             Annual Report 2016 Provincial Electricity Authority