
Page 74 - PEA_AnnualReport_2016
P. 74
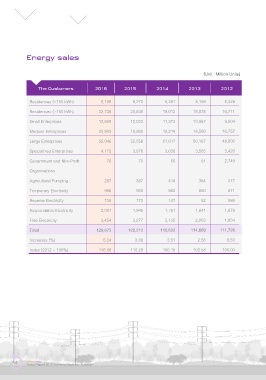
Energy sales


                                                                                                                                    (Unit : Million Units)


                  The Customers             2016         2015          2014          2013           2012

              Residences (<150 kWh)           8,198         8,270          8,291        8,159        8,339

              Residences (>150 kWh)          22,736         20,649        19,012       18,078       16,711

              Small Enterprises              12,698        12,033         11,373       10,987        9,804
              Medium Enterprises             20,903        19,988         19,214       18,580        16,757

              Large Enterprises              55,046        52,556         51,617       50,167       48,600

              Specialized Enterprises         4,172         3,876          3,636        3,585        3,420

              Government and Non-Proft          76            70            56            54        2,749
              Organizations

              Agricultural Pumping              267           387           414           354          377

              Temporary Electricity             986           989           982           950          871

              Reserve Electricity               138           172           141            52          586
              Suspendable Electricity         2,001         1,945          1,761        1,641        1,679

              Free Electricity                2,454         2,277          2,135        2,003        1,834

              Total                         129,673       123,212        118,632      114,609      111,726

              Increases (%)                    5.24          3.86           3.51         2.58         8.53
              Index (2012 = 100%)            116.06        110.28         106.18       102.58       100.00


      74     SMART PEA
             Annual Report 2016 Provincial Electricity Authority