
Page 52 - PEA_AnnualReport_2016
P. 52
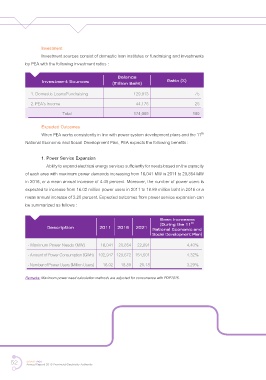
Investment
                    Investment sources consist of domestic loan institutes or fundraising and investments
            by PEA with the following investment ratios :


                                                      Balance
                    Investment Sources             (Million Baht)           Ratio (%)

               1. Domestic Loans/Fundraising                 129,913                    75

               2. PEA’s Income                                44,176                    25
                             Total                           174,089                   100


                    Expected Outcomes
                                                                                           th
                    When PEA works consistently in line with power system development plans and the 11
            National Economic and Social Development Plan, PEA expects the following benefts :


                    1. Power Service Expansion
                       Ability to expand electrical energy services suffciently for needs based on the capacity
            of each area with maximum power demands increasing from 16,041 MW in 2011 to 20,854 MW
            in 2016, or a mean annual increase of 4.40 percent. Moreover, the number of power users is
            expected to increase from 16.02 million power users in 2011 to 18.89 million baht in 2016 or a

            mean annual increase of 3.20 percent. Expected outcomes from power service expansion can
            be summarized as follows :


                                                                        Mean Increases
                                                                                      th
                                                                         (During the 11
                      Description            2011 2016        2021   National Economic and
                                                                     Social Development Plan)

             - Maximum Power Needs (MW)       16,041 20,854 22,891                   4.40%

             - Amount of Power Consumption (GWh) 102,947 129,672 154,501             4.32%
             - Number of Power Users (Million Users)  16.02  18.89  20.18            3.29%


            Remarks: Maximum power need calculation methods are adjusted for concurrence with PDP2015.


      52     SMART PEA
             Annual Report 2016 Provincial Electricity Authority